PowerPoint_3G_Remodels

PowerPoint_3G_Remodels

#PowerPoint3GRemodels


Project Description:

In the following project, you will format a presentation that describes backyard remodels.


Open   the file named Student_PowerPoint_3G_Remodels.pptx. downloaded with this project.


Change the Colors for the   presentation to Paper.


On Slide 1, format the   background with the Stationery texture, and then change the Transparency to   30%.


Select Slides 2 through 4, and   then apply a Solid fill to the background of the selected slides-in the fifth   column, the third color.


On Slide 2, hide the background   graphics.


On Slide 2, insert a Table with   2 columns and 4 rows. Apply table style Medium Style 3-Accent 1, and then   type the information below in the inserted table.
 

  Row 1, Col 1: Improvement Type; Col 2: Components
  Row 2, Col 1: Outdoor Kitchen; Col2: Barbecue, sink, bar, covered patio
  Row 3, Col 1: Swimming Pool; Col 2: Jacuzzi, pool, waterfall
  Row 4, Col 1: Fire Pit; Col 2: Fire pit, seating area, gas lines


Change the Font Size of all of   the table text to 28. Resize the table height to 5.8″, and then   distribute the table rows. Align   the table text so that it is centered horizontally and vertically within the   cells.


In the table, change the Font   Size of the first row of text to 32. Apply a Round style Cell Bevel to the   first row. Note, depending on your version of PowerPoint, this may be called   Circle.


On Slide 3, animate the picture   using the Wipe entrance animation starting After Previous. Change the   Duration to 01.00. Apply the Split entrance animation to the bulleted list   placeholder, and then change the Effect Options to Vertical Out.


On Slide 4, insert a Clustered   Column chart. In the worksheet, beginning in cell B1, type the following   data.
 

  In row 1, beginning in cell B1: Owner Installed, Contractor, Owner as Contractor
  In row 2, beginning in cell A2: Patio, 8000, 12000, 9500
  In row 3, beginning in cell A3: Bar, 3500, 5200, 4600
  In row 4, beginning in cell A4: Infrastructure, 5000, 9750, 8100
  In row 5, beginning in cell A5: Appliances, 3000, 4200, 3850


Apply Chart Style 8 to the   chart, and then remove the Chart Title element. Apply the Wipe entrance   animation to the chart and change the Effect Options to By Series.


On Slide 5, format the   background using solid fill color Dark Green, Background 2 and hide the   background graphics. (depending upon your version of Office, the color may be   named Dark Green, Text 2). From your downloaded project files, insert the   video p03G_Video1.mp4.


Change the Video Height to 5 and use the Align Center and   Align Middle options to position the video. Apply the Simple Frame, Black   video style.


On the Playback tab, change the   Video Options to Start the video Automatically. Trim the video so that the   End Time is 00:07 and then compress the media to Low Quality. (Mac users, the   Compress Media feature is not available on a Mac).


On Slide 6, hide the background   graphics, and then format the slide background by inserting a picture from   your downloaded grader files-p03G_Backyard.jpg.   Set the Transparency to 0%


Insert a Header & Footer on   the Notes and Handouts. Include the Date and time updated automatically, the   Page number, and a Footer with the text 3G_Remodels
  Display the document properties. As the Tags, type backyard   remodels 

input - Notepad File Edit Format View Help This is an input file to be used for project 1 in Computer Science 212 The words a

Write a main application called Project1.java, and a GUI (that extends JFrame) called WordGUI.java. The main program should open a file called “input.txt” which


*This is java programming 

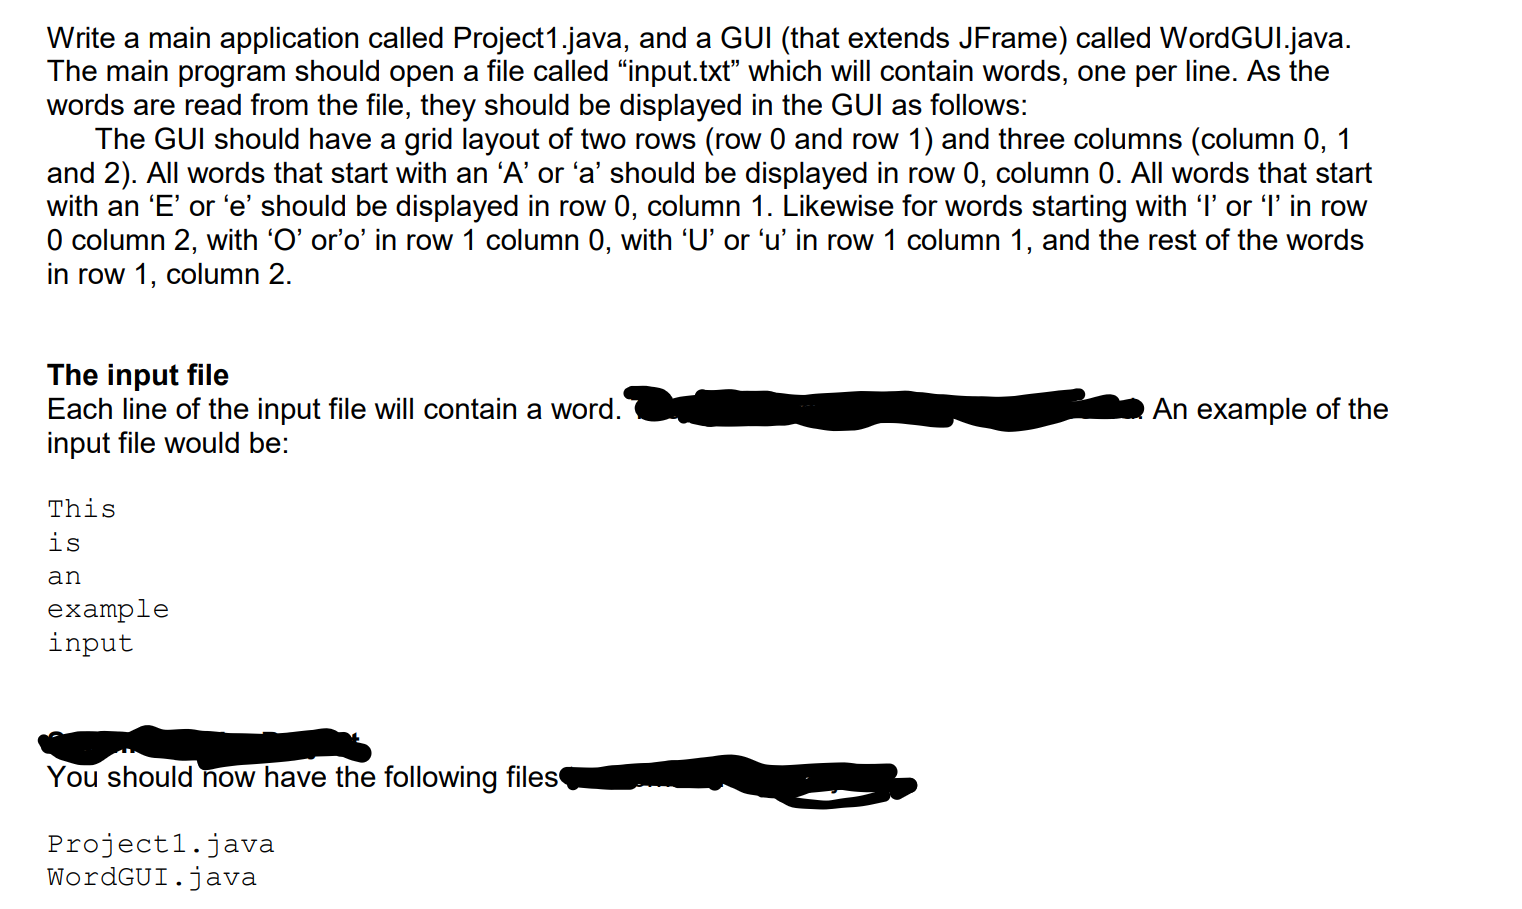
Write a main application called Project1.java, and a GUI (that extends JFrame) called WordGUI.java. The main program should open a file called “input.txt” which will contain words, one per line. As the words are read from the file, they should be displayed in the GUI as follows:

      The GUI should have a grid layout of two rows (row 0 and row 1) and three columns (column 0, 1 and 2). All words that start with an ‘A’ or ‘a’ should be displayed in row 0, column 0. All words that start with an ‘E’ or ‘e’ should be displayed in row 0, column 1. Likewise for words starting with ‘I’ or ‘I’ in row 0 column 2, with ‘O’ or’o’ in row 1 column 0, with ‘U’ or ‘u’ in row 1 column 1, and the rest of the words in row 1, column 2.

“input.txt” file is looks like that:

input - Notepad File Edit Format View Help This is an input file to be used for project 1 in Computer Science 212 The words aWrite a main application called Project1.java, and a GUI (that extends JFrame) called WordGUI.java. The main program should o

HW


what is cost Analysis

what is operations management

Defining how cost analysis is done and how operations management is done, also compare and contrast both

Consider the following requirements of the library project

Consider the following requirements of the library project Students register new course(s) (open for the current semester) through a two steps process

Step 1. Student chooses course(s) (from the opened courses that she can register) and send them to the advisor for approval (Selected courses can not exceed 30 credits)Step2. Each advisor use the system to approve the selected course(s) for each student. (Just select and approve. Do not consider dropping course(s) or adding new ones) For these requirements answer the following questions1. Write down two separate uses cases (one for each step)-(Only success story scenario with rules will be enough) (10)2. Define System Sequence Diagrams (SSD) for each use case (SSD not Sequence diagram) (10)3. Define the domain model that will be used in design process. (10)4. Design each use case by defining a Sequence Diagram for each SSD event. Use GRASP patterns to assign responsibilities. (50)5. Implement use case defined for step 1. (30)Notes – Check SSD diagrams from your book. SSDs and Sequence Diagrams are different things. – You can use the Domain Model from your Phase 2 report. But new concept(s) may be necessary for the new requirements – For each responsibility assignment in the Sequence diagrams, write down the Grasp Pattern type (controller, İnfo Expert ext.) and shortly explain the choice – You will implement only 1 use case (defined for step 1) – There must be one to one mapping between design and implementation (same classes, methods and associations)

Discussion 4- Project Processes

Chapter 7. Scope and Organizational Structure of a Project

Chapter 8. Management of Product, Process, and Support Design

Initial Postings: Read and reflect on the assigned readings for the week. Then post what you thought was the most important concept(s), method(s), term(s), and/or any other thing that you felt was worthy of your understanding in each assigned textbook chapter.Your initial post should be based upon the assigned reading for the week, so the textbook should be a source listed in your reference section and cited within the body of the text. Other sources are not required but feel free to use them if they aid in your discussion.

Also, provide a graduate-level response to each of the following questions:

  1. Describe the organizational structure of your school or company. What difficulties have you encountered working within this structure?
  2. Write a job description for a project manager in a matrix organization. Assume that only the project manager is employed full time by the project.
[Your post must be substantive and demonstrate insight gained from the course material. Postings must be in the student’s own words – do not provide quotes!] 

 [Your initial post should be at least 450+ words and in APA format (including Times New Roman with font size 12 and double spaced). Post the actual body of your paper in the discussion thread then attach a Word version of the paper for APA review]

TEXTBOOK

Title: Project Management ISBN: 9780134478661 Authors: SHTUB Publisher: Pearson Edition: 3RD 17 

Exp22_Excel_Ch06_Cumulative_AutoSales

 #Exp22_Excel_Ch06_Cumulative_AutoSales 

 #Exp22 Excel Ch06 Cumulative AutoSales 

 #Excel Chapter 6 Cumulative – Auto Sales 


Project Description:

You are the finance manager for Grossman Auto Sales. Your company offers in-house financing and as part of your duties you create reports detailing purchase options. You want to create a report to determine the optimal purchase price of a vehicle based on your customer’s budget. You also want to create one- and two-variable data tables to provide detailed payment options based on varying interest rates and down payments.


Download and open the file named   Exp22_Excel_Ch06_Cumulative_AutoSales.xlsx.   Grader has automatically added your last name to the beginning of the   filename.


Create appropriate range names   for Purchase Price (cell C5), Sales Tax (cell C6), Down Payment (cell C7),   Months Financed (C8), APR (cell C9), Down Payment Amount (cell C12), Amount   Financed (cell C13), and Tax Owed   (cell C14). Create the range names using the Create from Selection method,   using the values in the left column.


Edit the existing name range Tax_Owed to display as Tax. Note, Mac users, in the Define   Name dialog box, add the new named range, and delete the original one.


Apply the range names to the   existing formulas and functions in the worksheet.


Create a new worksheet labeled Range Names, paste the newly created range   name information in cell A1, and then resize the columns as needed for proper   display.


Use Goal Seek to determine the   optimal purchase price to reach a $500 monthly payment with all other variables remaining   unchanged.


Start in cell E5. Complete the   series of substitution values ranging from $20,000 to $75,000 at increments   of $5,000 vertically down column E. Apply Comma Style format to the range   E5:E16 with two decimal points and preserve the thick bottom border on row   16.


Enter references to the Down   Payment Amount, Tax Owed, and Monthly Payment (Cells F4, G4, and H4) in the   correct location for a one-variable data table. Use range names where   indicated.


Complete the one-variable data   table and format the results with Comma Style with no decimal places.


Apply Custom number formats to   cell F4:H4 that displays the text Down Payment in cell F4, Tax in G4, and Monthly Pmt in cell H4. Bold and center the   headings and substitution values.


Copy the purchase price   substitution values from the one-variable data table and paste the values   starting in cell J5. Adjust the width of column J as needed.


Type 5000 in cell K4. Complete the series of substitution   values from $5,000 to $15,000 at $5,000 increments. Apply Accounting Number   Format to the range K4:M4.


Enter the reference to the   Monthly Payment function in the correct location for a two-variable data   table.


Complete the two-variable data   table and apply Comma Style to the range K5:M16 with no decimal places.


Apply a Custom number format to   make the formula reference display as the descriptive column heading Purchase   Price. Bold the   headings in cells J4:M4.


Create a scenario named Best Case, using Purchase Price and   Months Financed. Enter these values for the scenario: 40000, and 36.


Create a second scenario named Worst Case, using the same changing cells.   Enter these values for the scenario: 50000, and 72.


Create a third scenario named Most Likely, using the same changing cells.   Enter these values for the ­scenario: 45000, and 60.


Generate a Scenario Summary report   based on Monthly Payment. Be sure to use best practice in formatting the   report by deleting Column A:B, Row 1, and the Current Values column.


Load the Solver add-in if it is   not already loaded. Set the objective to calculate a Monthly Payment of $500.


Use Purchase Price and Months   Financed as changing variable cells.


Set constraints to ensure the   Purchase Price is less than or equal to $50,000, greater than or equal to $30,000, and a whole number. 


Set constraints to ensure months   financed are less than or equal to 72, greater than or equal to 24, and a whole number.


Solve the problem and save the   results. Generate the Answer Report. If you get an internal memory error   message, remove Solver as an add-in, close the workbook, open the workbook,   add Solver in again, and finish using Solver.


Save and close   Exp22_Excel_Ch06_Cumulative_AutoSales.xlsx. Exit Excel. Submit the file   as directed.

Overview

    Overview:

The purpose of the project is to create an incident response/disaster recovery document that can be used by your organization in the event of a perceived or potential threat that may harm your business or employees. First, make sure it is a credible solution since a hurricane disaster plan for a business in Michigan is about as realistic as a loss of power due to a major snow storm at sea level in Hawaii. Yes, it could happen, but the likelihood is very slim. Second, it should be a threat that has a potential for happening such as mechanical failure, natural disaster, human caused and so on. Lastly, make sure it is a business and a geographic location you are familiar with to make this a worthwhile exercise.

Examples of incidents could include, but not be limited to;

Malicious Virus infects a computer

Employee Destruction of Critical Information

ISP provider goes down

City-wide Power Outage

Flooding

Physical break-in with damage and/or theft of major equipment

Paper Requirements:

(1pg) Cover page

Name

Course Number

Date

(~2pgs) Business overview

Current business situation

Customers

Employees

Geographical Location

Potential threats

The purpose of the document

Known threats encountered by other businesses in a similar setting

(5-8pgs) Incident response/disaster recovery/contingency planning

This may include more than one scenario

(1pg) Sources cited page.

APA or other formal documentation method is not required.

All sources must be listed here and cited within the document.

Five to ten sources should be used when putting your plan together.